Platform / The governance core

The risk register

The registers we have worked in held the score and not the reasoning, so when the board asked why a risk had moved, the answer had to come from somebody's memory.

The risk register: categories, scored risks with their sub-risks and where each sits against appetite A drawn view of the platform's risk register with the navigation beside it. Four figures across the top: total risks, risks outside appetite, risks unchanged for two or more quarters and quality flags. Beneath, the strategic category opened to show four risks, each with a computed score, its entity, a named owner and delegate, its sub-risks indented under it and a pill saying whether it is within or outside appetite. Connected risk intelligence All entities (Group) Dashboard Risk register Risk assessments Controls Control assessments KRI register KRI collection Breaches Risk events Remediation Committee packs Audit log MODULES TPRM & Supplier DD Obligations Management ICARA Operational Resilience Customer Oversight Portal RMRisk manager Risk register (33) 33 risks across 4 entities Add risk Total risks33 12 at 12 or more Outside appetite15 Stuck risks15 Unchanged for two quarters or more QA flags2 Owner below the level the rule expects Search risksAll entitiesAll scores Strategic7 risks3 outside 12Customer outcomesInvestment managementOwner named · Delegate named Outside 1.1 Suitability of advice 1.2 Product governance 12Group model riskInvestment managementOwner named · Delegate named Within 2.1 Revenue concentration 2.2 Strategic execution 2Regulatory relationshipAdvisoryOwner named · Delegate named Within 3.1 Notification timeliness 15Climate and sustainability disclosureInvestment managementOwner named · Delegate named Outside 4.1 Climate risk disclosure

Drawn from the platform.


What changes

Every risk carries its owner, its appetite and the reasoning behind both, and the platform works out the score, so nobody types one in. When the board asks why a number moved, the answer is on the record.

Causes and consequences come from a shared list (so a cause is recorded the same way each time), which means a cause can be counted across the whole register and compared.

A category with three risks beneath it, one expanded A category box labelled client assets sits above three risk rows. The first is expanded to show its residual score of 9, a named owner, an appetite position with reasoning, an inherent score of 16 resolving to a residual of 9 and a bow-tie with three causes and two consequences. CATEGORY Client assets 9 Client money reconciliation fails Owner: named · Appetite: cautious, with the reasoning Inherent 16 → Residual 9 Bow-tie 3 / 2 6 Unauthorised transfer 4 Misapplied client instruction
Two levels, a computed score and the reasoning held on the record.

In detail

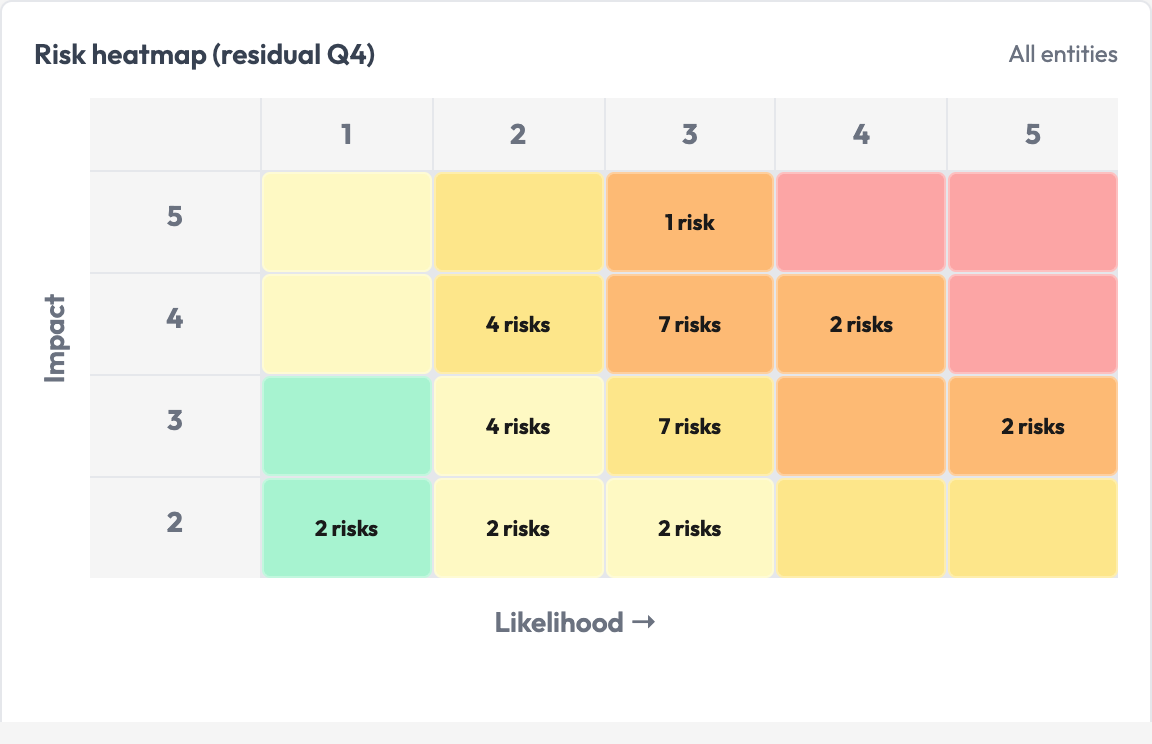
A residual risk heatmap from the demonstration organisation: impact on the vertical axis, likelihood on the horizontal, each cell counting the risks that sit there
The residual heatmap on the dashboard, from demonstration data, as at the fourth quarter. Every cell is a count of live risks.

The register has two levels, categories and the risks beneath them. Every risk carries an inherent and a residual position across likelihood and impact, and the score is computed (a typed score is how errant figures get in). Eight impact dimensions are available and all are optional, so a framework that scores on three does not carry five empty columns.

Each risk records a named owner, an appetite position with its reasoning and a cause and consequence structure through bow-tie analysis. Causes draw on a shared library you control, so the same cause is counted across the register and is not typed five different ways. Risk events (incidents and near misses) are recorded against the risk they belong to, and not in a separate list that nobody reconciles.

The evidence it leaves behind

Every change to a risk writes an audit entry (who, what changed, from what to what, when and in what role), and nothing edits or deletes it. How the record is protected